




Breadcrumb
Eureka CPI 2026
July 21, 2026

Press Release: Eureka CPI Project 2026
June 2, 2026
The Eureka Consumer Price Index (CPI) is a tool created by the Cal Poly Humboldt Economics Department to show changes in prices for major consumer goods in Humboldt County. Each spring semester in March students collect hundreds of local prices. This year Nina, Kyle, and Lonna collected the prices.
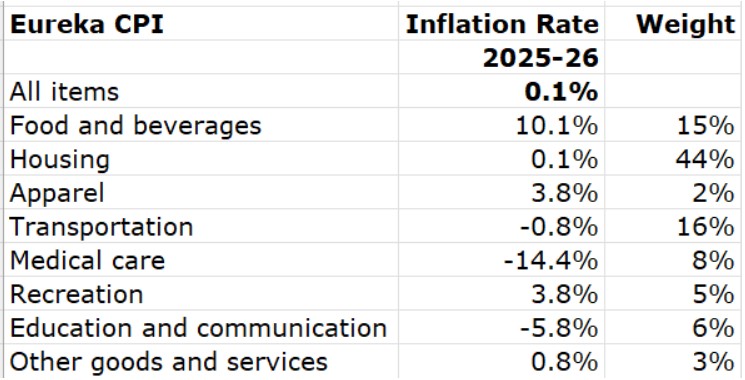
We calculate the inflation rate is 0.1 percent in Eureka from 2025 to 2026. Last year we calculated the inflation rate to be 4.4 percent.
The CPI is a weighted average of eight categories. The weights of each category in constructing the overall inflation rate are given below, with the greatest weight on Housing (44%) and the smallest weight on Apparel (2%). Prices increased the most in the Food and Beverage sector and the inflation rate was 10.1 percent. Apparel and Recreation each experienced inflation of 3.8 percent, while Other Goods and Service experienced inflation of 0.8 percent. Housing prices were practically unchanged with an inflation rate of 0.1 percent. At the other end, the Medical Care sector had the lowest inflation rate at -14.4 percent, which indicates that prices fell by 14.4 percent. The Education and Communication sector had -5.8 percent inflation and Transportation prices fell by 0.8 percent.
We also collect consumer cannabis prices based on a limited number of items including flower, wax cartridges, gummies, and pre-rolls. Overall average cannabis prices rose a very small 0.6 percent.
For comparison to other regions, the State of California had an inflation rate of 3.4 percent from February 2025 to 2026 and the US inflation rate was 3.3 percent from March 2025 to 2026. San Francisco, the nearest city with BLS inflation data by category, had an inflation rate of 2.5 percent from March 2025 to 2026. The category-level data are reported below.
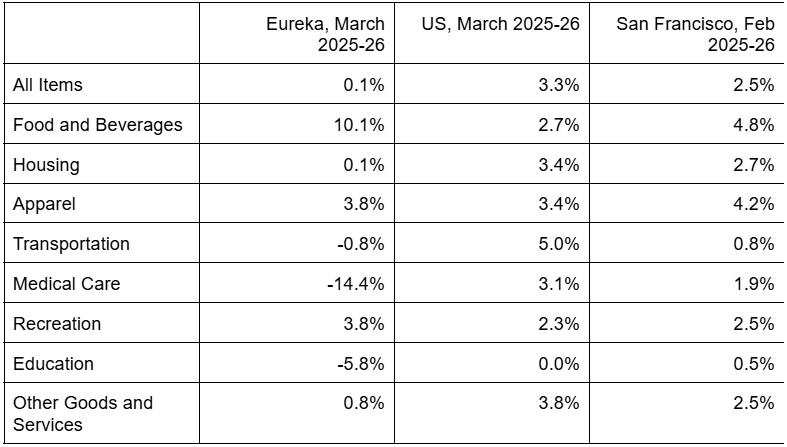
Why is the overall inflation rate in Eureka lower than these other locations? The most straightforward reason is that two of the largest components of spending, Housing and transportation, barely changed, with an increase of 0.1% and a decrease of 0.8%, respectively.
Additionally, one source of variability, or “noise,” is product substitution. When a specific good is no longer available, then we must find an appropriate replacement, and sometimes the best substitute has a price that is different from the original good. While finding similar substitutes may be relatively easy in large cities, in small rural areas it may be more difficult, which may lead to more variable recorded prices.
It is important to keep in mind that the BLS collects tens of thousands of prices each month, while we collect around 500 prices. This makes our inflation rate more variable, even if our methods are unbiased. So while we calculate the inflation rate correctly on average, some years may be an outlier. For example, consistent physician and hospital service prices are difficult to obtain. If we assume no change in the Medical Care component, then the Eureka overall inflation rate becomes 1.4%. This is still below the overall rate measured for other regions, but it shows how changes in one sector can impact the entire calculation.
Three years ago we greatly expanded the number of prices we collect from 287 to 529. This was an effort to reduce the noise from a small sample size. More prices should ensure greater accuracy and make our Eureka CPI more consistent with the official CPI as reported by the US Bureau of Labor Statistics (BLS).