



Breadcrumb
Transportation
According to the CSU Transportation and Parking Policy, campuses shall use and promote transportation options that have the lowest total cost of ownership, lowest carbon emissions and best fit for regional transportation needs to mitigate congestion and pollution while maintaining access to campus. The Office of Sustainability works with Transportation and Parking Services and regional partners to improve transportation infrastructure, to deploy education and outreach campaigns, and to develop alternative transportation programs. In 2025 Humboldt was recognized as a Bicycle Friendly University (Bronze) by the League of American Bicyclists.
Goals
In 2017 Humboldt commissioned a Parking Market Demand Analysis & Financial Feasibility Study. Key study goals include
- Minimize vehicular traffic on campus
- Help people to not bring cars to campus
- Find alternative ways to meet demand
Humboldt is following recommendations in the Parking Market Demand Study to curb parking constraints and improve commuter services to campus in a sustainable manner.
Status
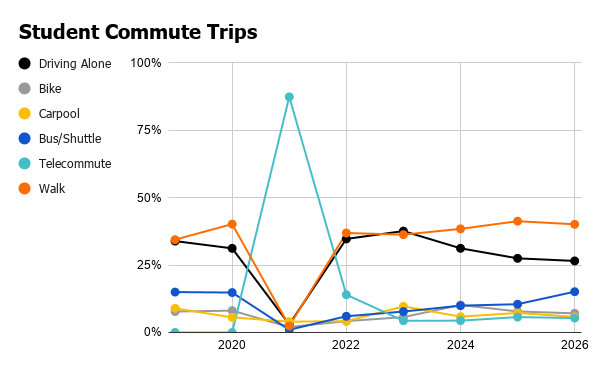
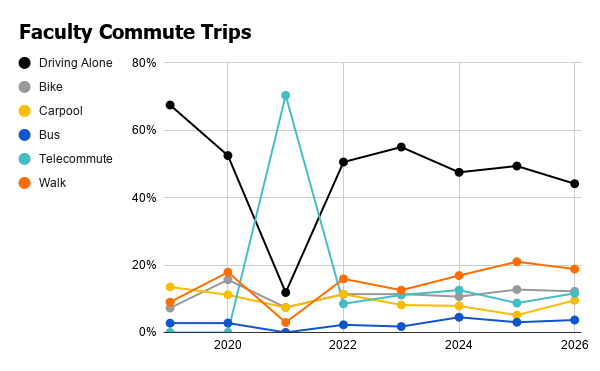
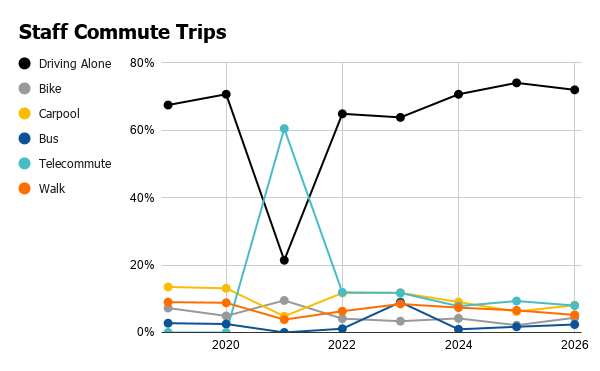
Commuter emissions can account for 15-20% of the university’s carbon footprint. Single occupant vehicle (SOV) commuting to and from campus contributes the most to traffic congestion, parking constraints, noise and air pollution and emissions. According to the 2025-26 Commuter Survey, nearly one third (32.0%) of all commute trips taken by student, faculty and staff respondents combined were by driving alone, a 1.5% decrease compared to the results of the previous year’s survey. One in ten (10.6%) of these SOV trips were 1.5 miles or less from campus, a distance considered to be within walking, bicycling or transit distance to campus. While we continue to see increased adoption of sustainable transportation by the campus population, there still are too many cars and the university continues to face parking challenges, leading to additional miles traveled to find a vacant stall, missed classes and meetings, and other frustrations. However, building additional parking is not the answer. Rather, to address this, the university has embarked on the development of a Transportation Demand Management (TDM) plan to reduce SOV trips, Vehicle Miles Traveled (VMT) and carbon emissions.
Download the 2026 Commuter Report >>>
Projects
- Jack Pass program uses ID card to ride local bus systems (Parking & Commuter Services)
- Zipcar car-sharing program with five vehicles to reserve by the hour or day (Parking & Commuter Services)
- Humboldt Bikeshare Program with bicycles available to rent at two stations on campus and in Arcata (Office of Sustainability)
- Faculty/Staff Ride Match Service and Student Ride Match Service to connect carpoolers
- Free virtual One-on-One Commute Consultations with a Commuter Specialist
- Carpool Preferential Parking incentivizes carpooling to campus (Parking & Commuter Services)
- Electric vehicle charging stations in the G12 parking lot
Next Steps
- Develop, fund and implement a transportation demand management (TDM) plan
- Develop remote parking with public transportation services to campus
- Develop Guaranteed Ride Home (GRH) program as a safety net for employees who choose to carpool, take public transit, bike or walk to campus
- Improve outreach and marketing of sustainable transportation programs and resources
Learn More and Get Involved
- Transportation & Parking Services provides information on Humboldt’s alternative transportation programs and parking
- The Bicycle Learning Center provides free instruction, tools and parts for bike maintenance and safety. Paid, for-credit and volunteer hours available for students
- Students, faculty and staff on the Sustainable Transportation Committee evaluate and recommend policies, procedures and programs
Explore Sustainability Dashboard Categories
The Humboldt Sustainability Dashboard makes visible our progress towards meeting our sustainability goals, by featuring updated metrics for key sustainability performance areas, along with project descriptions, next steps and information on how you can learn more and get involved. Click through the sustainability categories and join the movement!
This dashboard is brought to you by the Humboldt Advisory Committee on Sustainability (HACS), a group of students, faculty and staff who believe that continual improvement in sustainability can be achieved with transparency and accountability.